-
New Media Ecosystem and Media Education 3.06 Topics4 Quizzes
-
Platforms: The Power of GAFAM (Google, Apple, Facebook, Amazon and Microsoft)5 Topics3 Quizzes
-
Algorithms and Their Role in Contemporary Digital Media Business6 Topics4 Quizzes
-
Netflix and Algorithmic Literacy6 Topics4 Quizzes
-
Fact-Checking Services as New Form of Digital Media5 Topics3 Quizzes
Participants14
Business Models of Platforms Companies

Marta 5 September 2022
Authors of the report to European Council called “Study on media literacy and online empowerment issues raised by algorithm driven media services” (2020) recommended distinguishing between the two different kinds of business models used by platform companies: (1) matching services and (2) services supported by advertising. Let’s learn more about these algorithm-driven business models.
MATCHING SERVICES use algorithms to connect consumers with the services they need and are interested to use. In this case platforms are collecting money as a percentage of the cost of the service or taking direct subscription fees from users. Matching services can be divided in:
- recommendation systems that analyse user preferences or data (user profiles, past online purchases, website visits, demographic characteristics) to learn about their interests and to provide recommendations based on it (books, films, people, etc.). Examples may include Netflix, dating sites and travel booking sites.
- supply-demand systems which link people offering a product or service (hotel, house, driving service, etc.) to those in need of them. In some platforms, algorithms can be applied to determine prices, which can be personalised.
ADVERTISING-DRIVEN SERVICES
these services base their business model mostly on their ability to effectively target adverts at specific users or user groups. Search engines and content aggregators could fall under this category:
- search engines show personalised advertisements for users looking for information or services. Platforms tailor the content based on the location and search history, and other data points of the recipients.
- content aggregators employ algorithms to choose and tailor a never-ending stream of content that is provided to consumers. This content can be tailored to the (explicit or implicit) tastes of the user. This is applied by majority of social networking sites.
The other approach suggests separating two business models based on whether you are the consumer or the product.
- For the first model, where you are the consumer the main source of revenue is derived from the sale of products and services to you. This group includes Apple, Amazon and Microsoft. However, these platforms operate also in advertising market.
- In the second model, for companies that treat you as a product, like Google and Facebook, most of the revenue comes from advertising. The revenue here is mostly based on a business model by which companies are not paid in money by consumers but in data. User believes that he is a consumer, but in fact he is a product for the company which tracks, collects, stores, and leverages the data about his digital activities. You can read more about this topic in our chapter: “Invisible technologies and visibility of content”. Now we will look at how exactly GAFAM companies make money.
A global internet service provider Google with its headquarters in California was established in 1998. Google’s original vision was to create a web search engine based on the PageRank algorithm, but today the company provides a wide range of desktop, mobile, and online products and services. Google also owns video content sharing site YouTube. It has been heavily integrated into Googles online presence and has transformed how online video curation and user-generated content are distributed around the world.
Apart from online search and online video, Google has Android mobile operating system which as of January 2022 accounted for almost 70 percent of the global smartphone operating system market. Google owns a wide range of other products, including but not limited to the Chrome browser and operating system ChromeOS, hardware including the Chromecast and company’s series of mobile devices such as the Nexus and Pixel devices, as well as online payment system Google Pay. Recently, Google has been making inroads in the virtual assistant market by releasing Google Now and Google Assistant. The company is currently investing in voice-controlled smart-home speakers and devices such as its Google Home series.
Despite the vast scope of Google products, the company still collects the majority of its revenue through online advertising on Google Site and Google network websites and Google Search continues to be the company’s major web-based product and generates main incomes for company.
According to Statista (German company specializing in market and consumer data) in July 2022, Google had a share of around 83 percent of online search market, meanwhile engine Bing accounted for nearly 9 percent of the global search market, while Yahoo’s market share was 2,55 percent.
Advertising brings the majority (209,50 billion U.S. dollars in 2021) of Google’s revenue, which amounted to a total of 256,73 billion U.S. dollars in 2021:
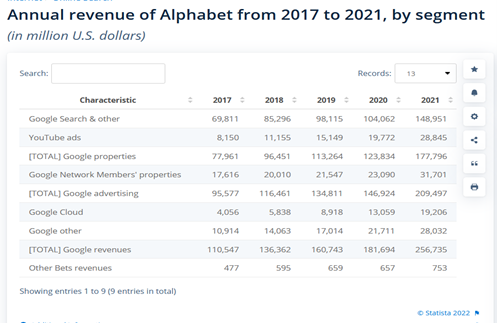
In August 2015, Google underwent a restructuring process to become a division of parent firm Alphabet Inc. Along with the mobile operating system Android and the video-sharing website YouTube, Google continued to control internet search, advertising, apps, and mapping. Other Google businesses, including Calico, a company that conducts longevity research, Nest, a maker of home goods, and research lab Google X, became independent companies under Alphabet. In-depth information on Google’s and their parent companies’ Alphabet Inc financial performance is available on their website for investors: https://abc.xyz/investor/
APPLE
Steve Jobs and Steve Wozniak cofounded Apple in 1977 and started out in the business of kit computers. Today Apple has a vast range of well known products and services. Since 2010, it has ranked among the most valuable companies in the world. Company designs, manufactures and markets smartphones, personal computers, tablets, wearables and accessories, and sells a variety of related services.
According its investor relations website investor.apple.com Apple products include: iPhone (smartphones based on its iOS operating system), Mac (personal computers based on its macOS® operating system), iPad (multipurpose tablets based on its iPadOS® operating system), diferent wearables, and home and accessories products such as AirPods, Apple TV, Apple Watch, Beats products, HomePod, iPod touch. Apple services include digital content services sold to consumers, advertising services and cloud services.
The company operates various digital platforms and applications, including the App Store, that allow customers to discover and download applications and digital content, such as books, music, video, games and podcasts. Apple also offers digital content through subscription-based services, including Apple Arcade, a game subscription service; Apple Music, which offers users a curated listening experience with on-demand radio stations; Apple News+, a subscription news and magazine service; and Apple TV+SM, which offers exclusive original content. During 2021, the Company released Apple Fitness+SM, a personalized fitness service.
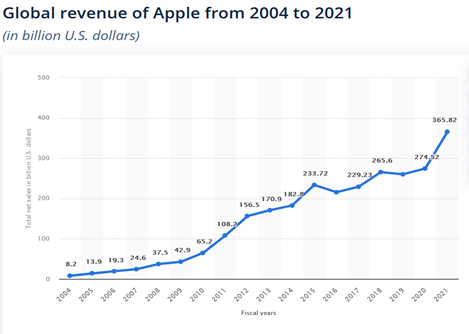
According to Statista, in the 2021 financial year, Apple’s total net sales reached 365.82 billion U.S. dollars, as an improvement over the historical record of 274.52 billion dollars set in 2020:
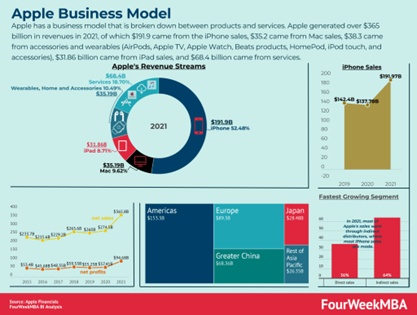
The split of $365 billion shows that absolutely major part ($191.9) came from the iPhone sales, meantime $35.2 came from Mac sales, $38.3 came from accessories and wearables (AirPods, Apple TV, Apple Watch, Beats products, HomePod, iPod touch, and accessories), $31.86 billion came from iPad sales, and $68.4 billion came from services.
From this infographic you can learn more about Apple’s business model:
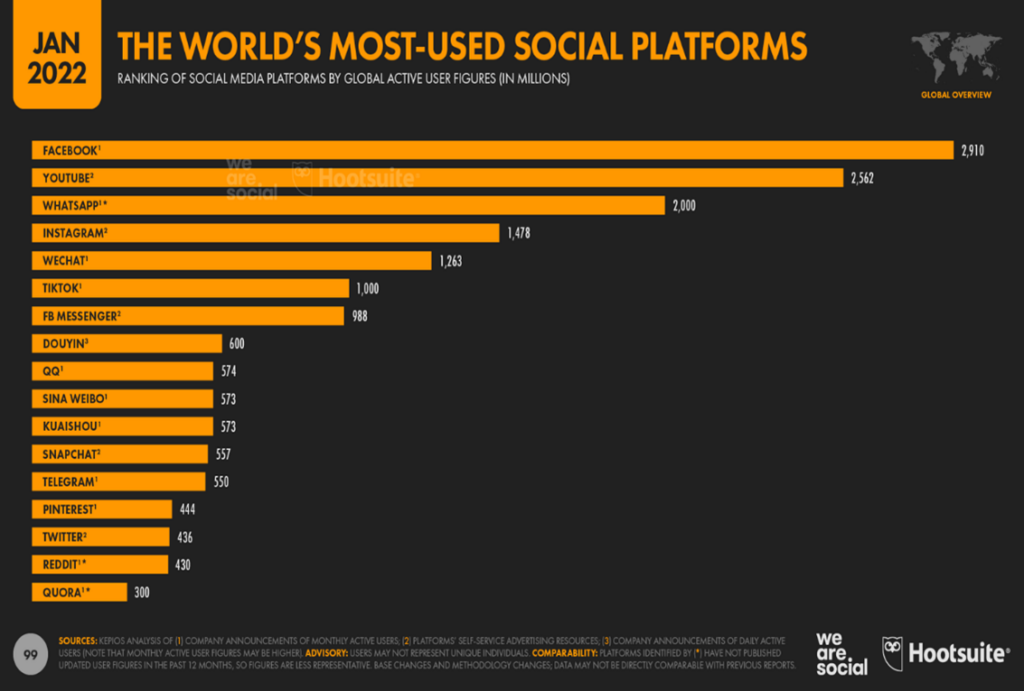
Facebook was created in 2003 / 2004 as an innovative digital platform by Mark Zuckerberg and a group of his college mates with the goal of linking Harvard students through an online community. The company (we must remember that Facebook changed its name to META on October 28, 2021) currently (in 2022) owns four of the most-used worlds social platforms: social media platform Facebook (2,9 billion users) as most used in the world, following by messaging app WhatsApp (2,0 billion users), photo- and video-sharing app Instagram (1,5 billion users), and FB Messenger (988 million users).
3.65 billion people were using at least one of the company’s core products (Facebook, WhatsApp, Instagram, or Messenger) monthly during the second quarter of 2022. And Meta’s (formerly Facebook Inc) revenue in 2021 amounted to roughly 117 billion US dollars, up from around 86 billion U.S. dollars in the 2020.
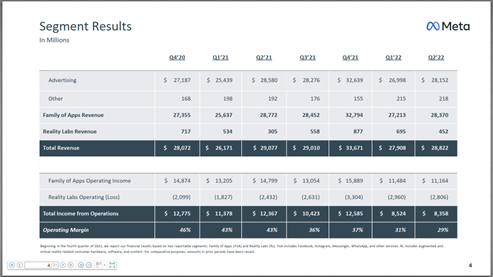
The main source of income is digital advertising on its social platforms. Additionally, Meta offers a user-connecting ecosystem through its Oculus virtual reality products. In their financial reports Meta splits its results into two segments: the Family of Apps, which includes Facebook, Instagram, Messenger, WhatsApp and Reality Labs (RL), which includes the company’s virtual and augmented reality products and services.
You can use Statista or Hootsuite https://www.hootsuite.com/en-GB/resources/digital-trends-q3-update as a reliable source for data on amount of platform users and revenue, but you can also update your knowledge by visiting the platforms investors website. For example, about Meta revenue you just need to locate and open the “Earning Slides” here: https://investor.fb.com/financials/default.aspx.
Meta is usually reporting their financial results yearly and also quarterly based:
AMAZON
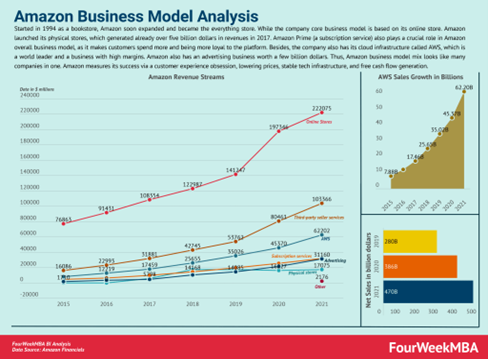
Amazon was founded in in 1994 in Washington. It began as a modest online book vendor but has since that developed into the biggest online retailer in the world, with activities in e-commerce, cloud computing, and digital advertising. Today due to its global scope and reach, Amazon is considered one of the most valuable brands worldwide.
Among its products are the Alexa (a virtual assistant that takes natural language commands or questions, either in written or spoken from, and attempts to carry out a task or provide an answer for the user), Kindle e-reader (Kindle devices enable users to browse, buy, download, and read e-books, newspapers, magazines and other digital media via Kindle Store), the Amazon Prime Video streaming service.
Most of the company’s revenue is generated through e-retail sales of electronics and other products, followed by third-party seller revenues, subscription, and AWS cloud services. Amazon Web Services (AWS), launched in 2006, provides services to businesses, government agencies, and academic institutions to store information and deliver content. It presently (2022) produces all of Amazon’s operating profits and is expanding quickly. Meantime the fastest-growing Amazon segment in 2021, compared to 2020, was advertising, in 2021, it grew to over $31.1 billion from over $21.4 billion in 2020. Visit https://fourweekmba.com/amazon-business-model/ to view an infographic and more information about Amazon business model.
MICROSOFT
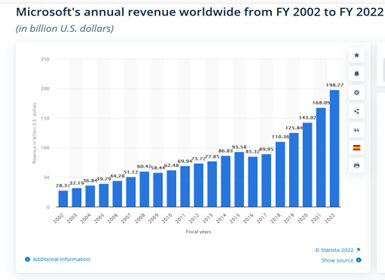
One of the world’s largest and most successful technology companies, Microsoft’s is founded by Bill Gates and Paul Allen in Albuquerque, New Mexico, in 1975. The company has been based in Washington since 1986. Commercial licensing of Microsoft’s software and operating systems have historically generated most of its revenue. In 2021, Microsoft generated $168 billion in sales, a record high since its founding. Server products and cloud services accounted for 31% of total sales, followed by Office goods and services (24%), Windows (14%), and Gaming (9%).
Nowadays Microsoft splits its business into three segments: (1) productivity and business processes, (2) intelligent cloud, and (3) more personal computing. Both the client demography and the product type are used to identify these categories.
Microsoft’s productivity and business processes segment includes a portfolio of products designed to enhance corporate productivity, communication, and information services. One of its major products is Microsoft’s Office software suite, including both the commercial and consumer divisions.
The intelligent cloud segment comprises all of Microsoft’s public, private, and hybrid server products as well as cloud services for business. These include Microsoft Azure, SQL Server, Windows Server, GitHub, Enterprise Services, and more.
Microsoft personal computing segment includes: The Windows operating system, surface device, gaming products, and search and news advertising are all included in this segment.
Microsoft also owns the professional networking site LinkedIn, which it purchased in 2016. With a hybrid business model, LinkedIn makes money from advertising, premium memberships, and hiring solutions. On a year-over-year basis, LinkedIn’s revenue has been steadily increasing since 2017. LinkedIn’s annual revenue topped ten billion dollars in the fiscal year 2021, up from eight billion dollars in the fiscal year 2020 https://www.statista.com/statistics/976194/annual-revenue-of-linkedin/.
As LinkedIn’s user base grows to more than 800 million economically active users in 2022, advertisers are increasingly interested in the platform:

In addition to increasing exposure for their brand, products, and services, marketers can also successfully target expert audiences on the LinkedIn platform with sponsored posts, lead-generated ads, or other advertising formats.